Let's make our Trading system simple to trade
For any system you are going to trade in your life, these below four points should be crystal and clearly written on your trading system development process
1. What to BUY 2. When to BUY 3. How much to BUY 4. When to SELL
TRADING SYSTEM DEVELOPMENT PROCESS
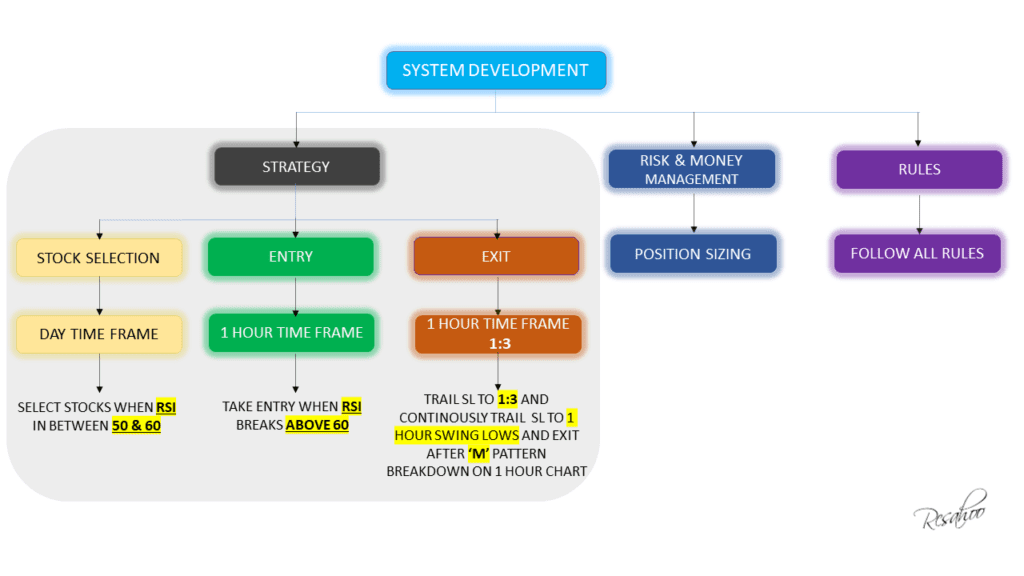
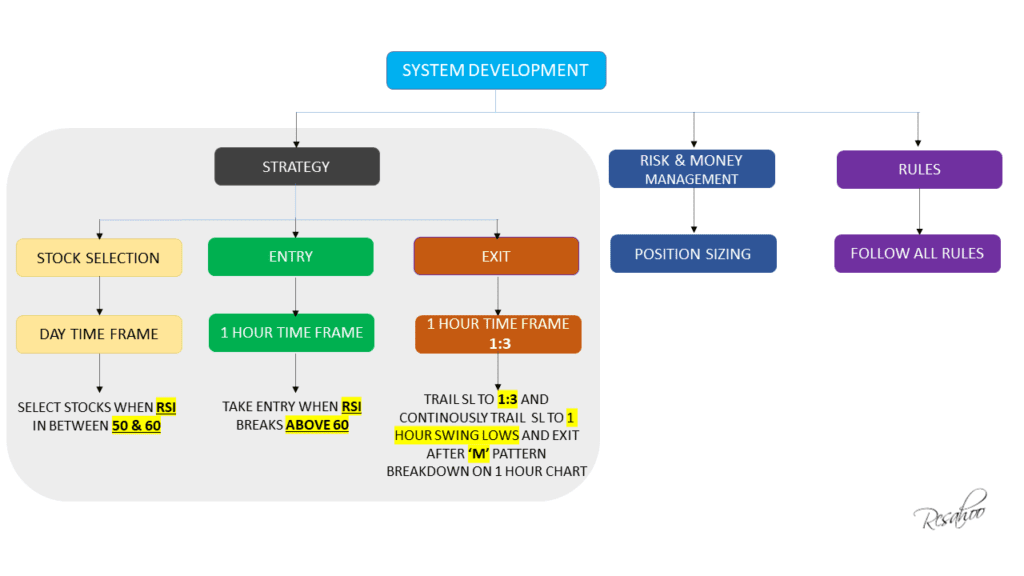
WHOLE STRATEGY FRAMEWORK


1. What to buy - Nifty Future Stocks
STRATEGY
STOCK SELECTION
- Stock selection only from Nifty Future Stocks. Click here to know the list of all Nifty Future Stocks.
- Remove stocks from your watchlist, which prices below 100.
- Among those stocks select only uptrend stocks. (Making Higher highs on Day time frame).
- Create another watchlist and put those stocks on that watchlist where the stock RSI on the day time frame is above 50 and below 60.
- To make your trade high probability trade, if there is a pattern on stock then it will work like magic. (Patterns like – Inverse Head & Shoulder, Triangle, Bullish Flag, Bullish pennant, Bullish Rectangle, Double bottom, Channel, Cup and handle, 3rd times Resistance test, Consolidation near Resistance)

HOW TO SELECT STOCKS ON DAY TIME FRAME
RSI RANGE BETWEEN 50 TO 60
- Among all Nifty Future stocks only select those stocks with RSI on day time frame above 50 and below 60.
- Find any patterns on the daily chart to make your trade high probability trade.
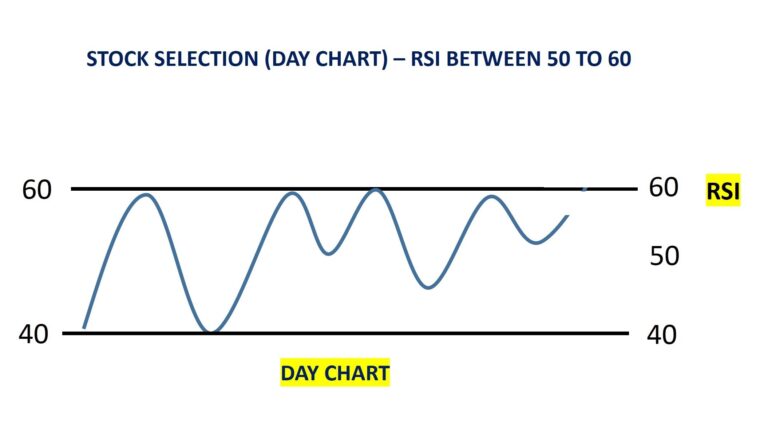
DAY CHART - RSI BETWEEN 50 TO 60
BHARAT FORGE
Slide Chart From Left to Right
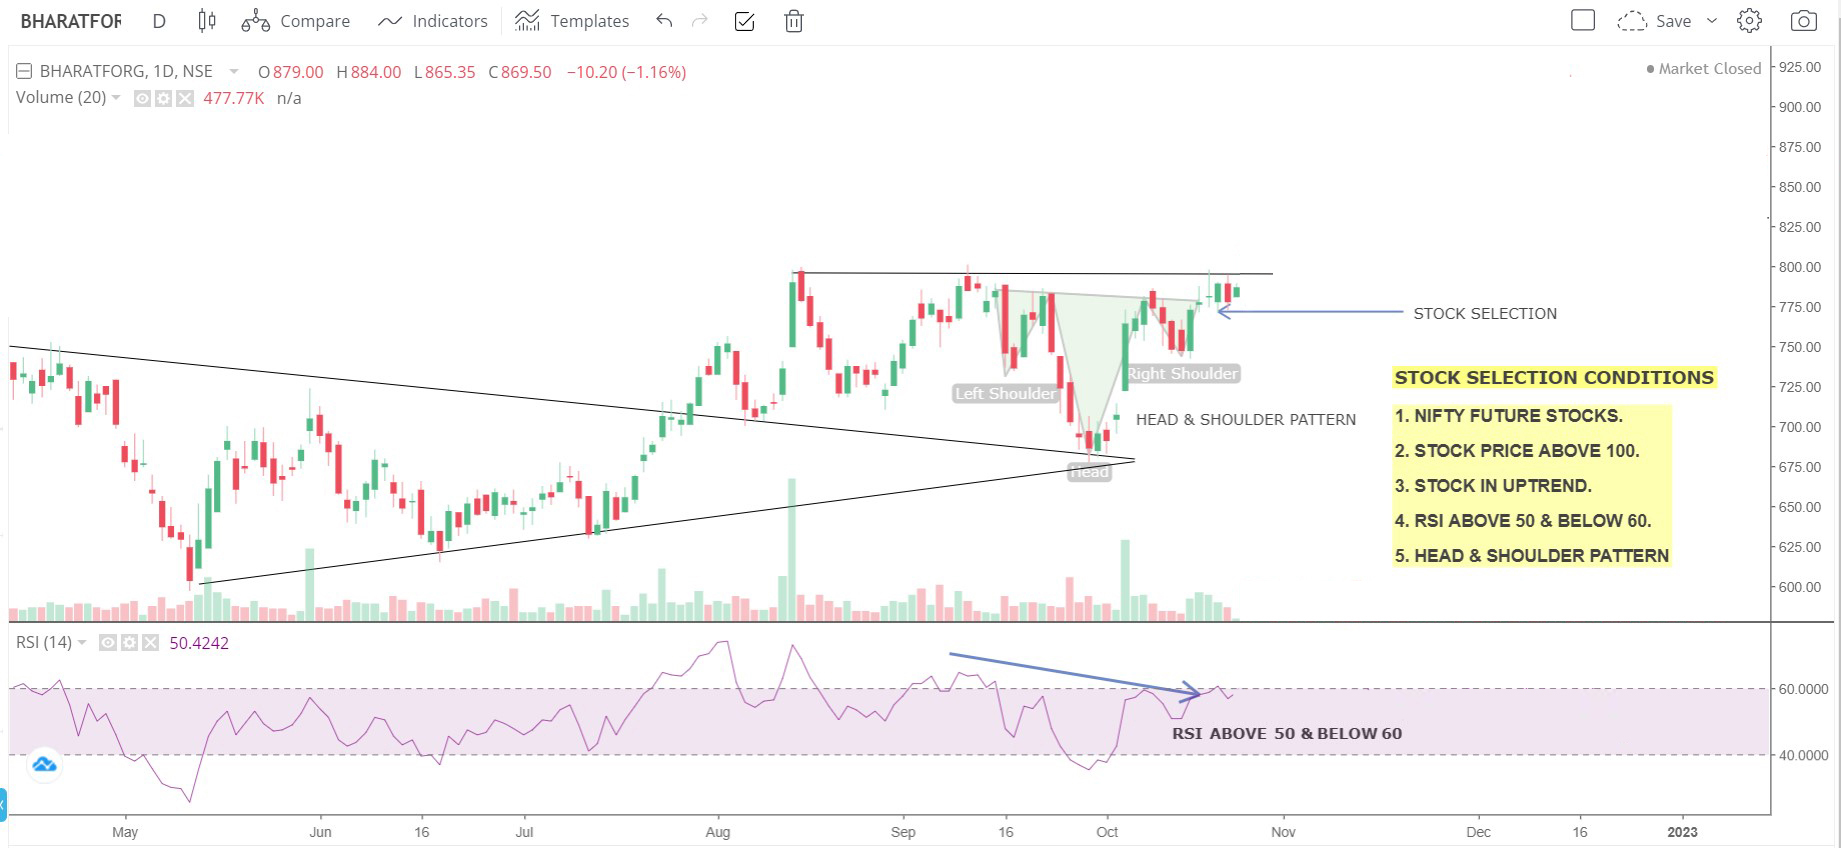
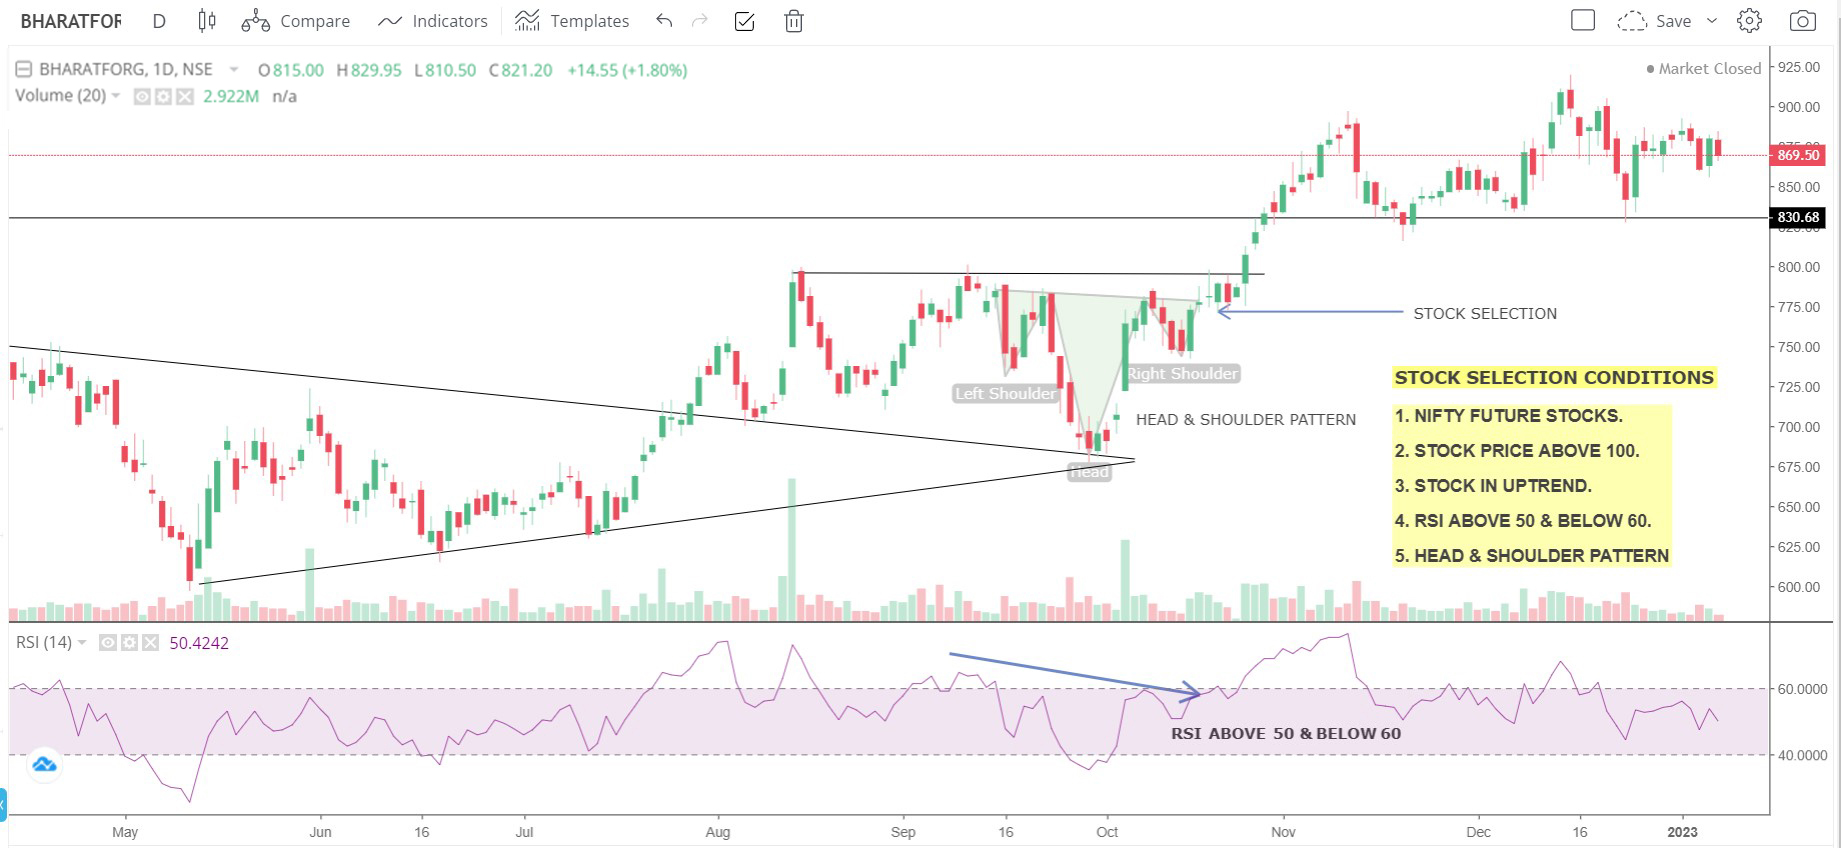
Slide Chart From Left to Right


2. When to buy - RSI breaks 60 on hourly chart
HOW TO TAKE ENTRY ON HOURLY TIME FRAME
RSI BREAKS 60
- When RSI breaks above 6o on the hourly time frame take an entry.
- On entry time if the index (Nifty) is uptrend it gives you quick momentum.
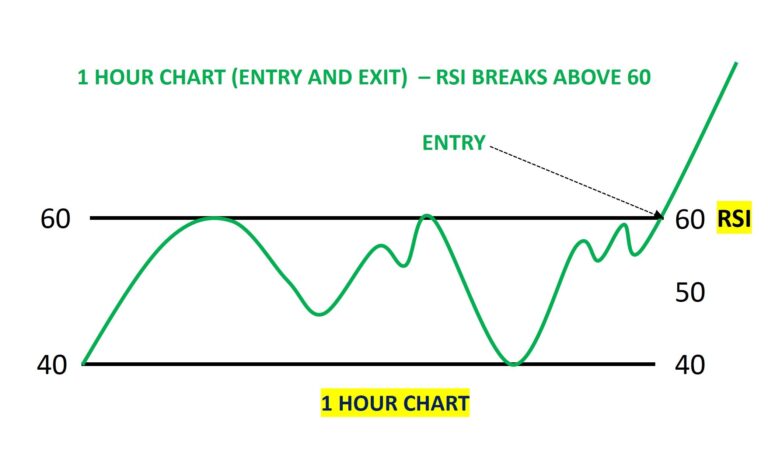
DAY AND HOURLY CHART
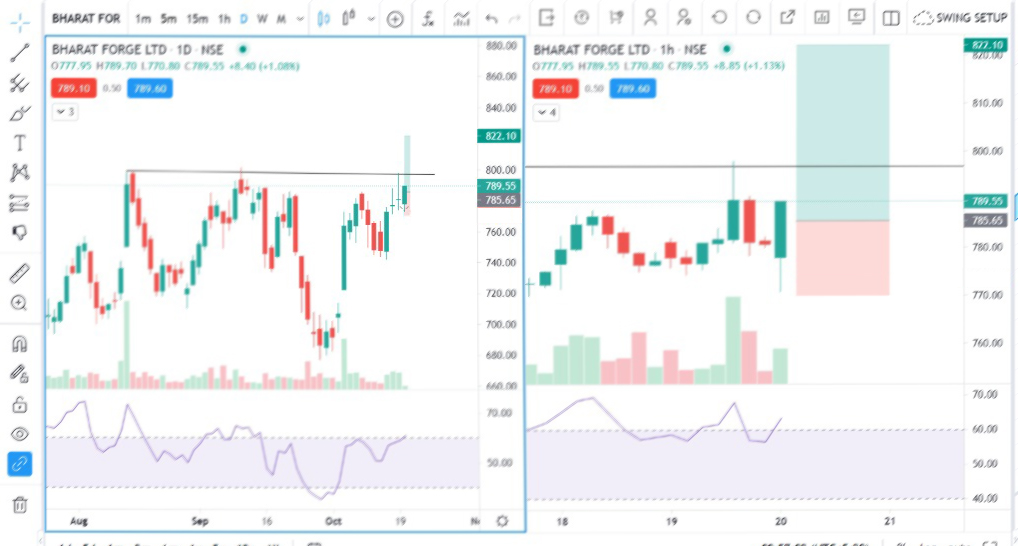
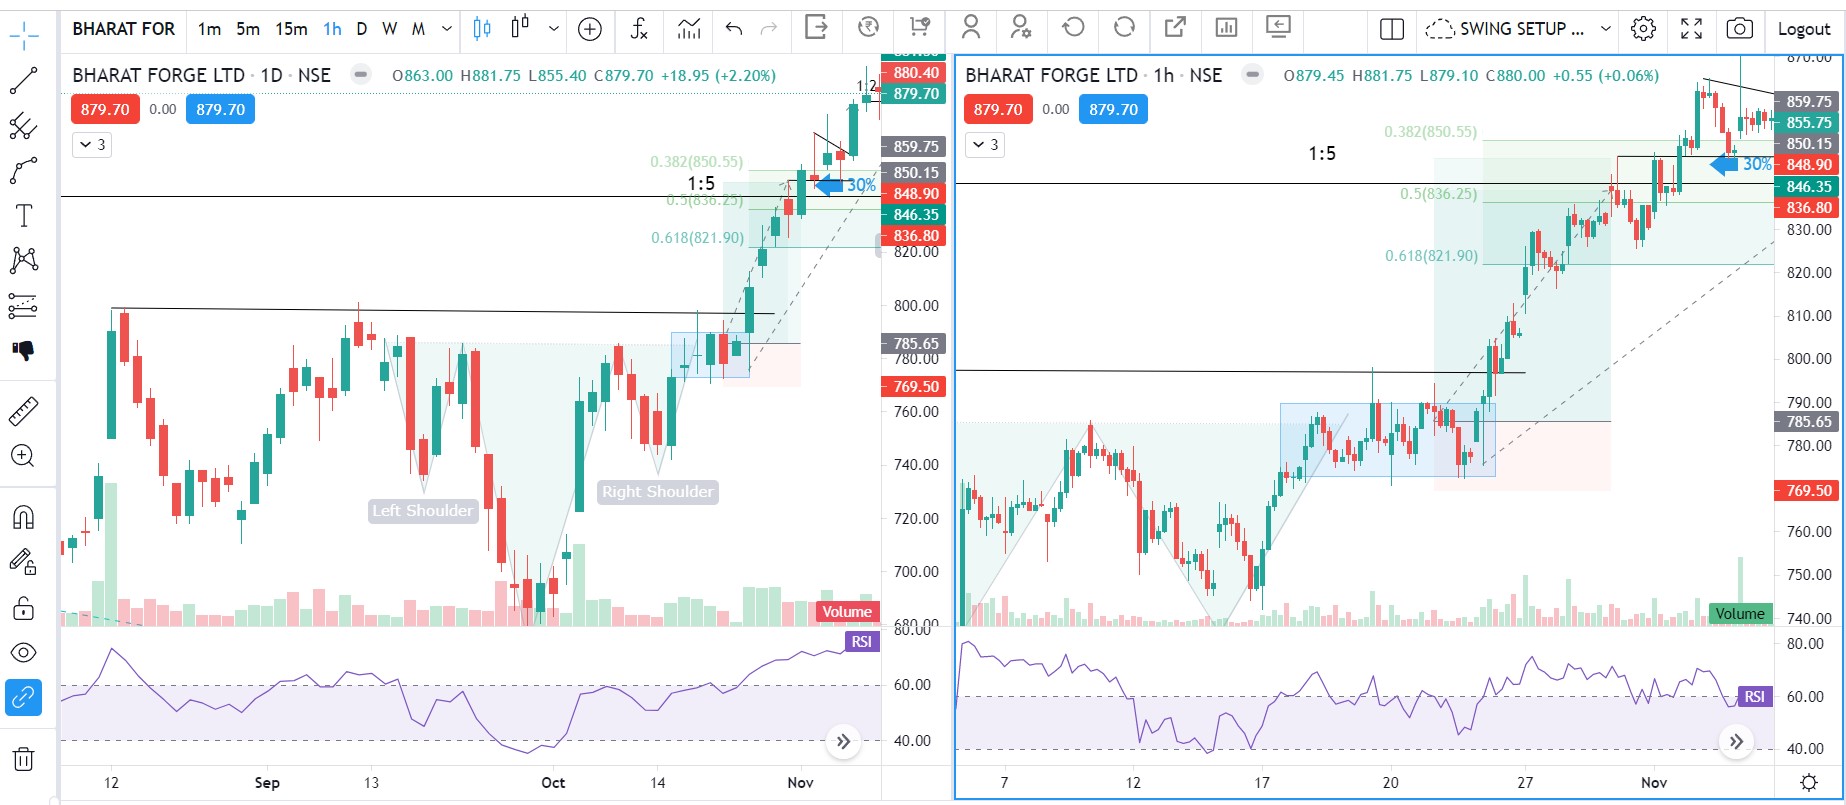
BHARAT FORGE
DAY CHART
1 HOUR CHART


3. How much to buy - As per Risk Management
4. When to Sell - Trail SL to 1:3 & after 'M' pattern breakdown
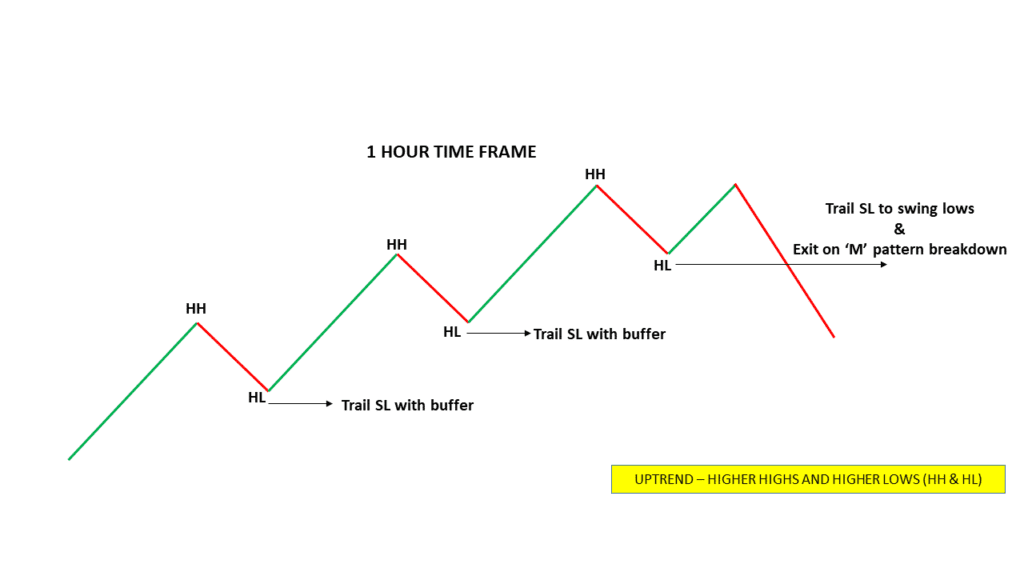
- This strategy can easily gives you 1:3 but to get more profit trail your SL to 1 hour swing lows with buffer and exit only after trend reversal pattern called ‘M’ pattern.
Stoploss Point

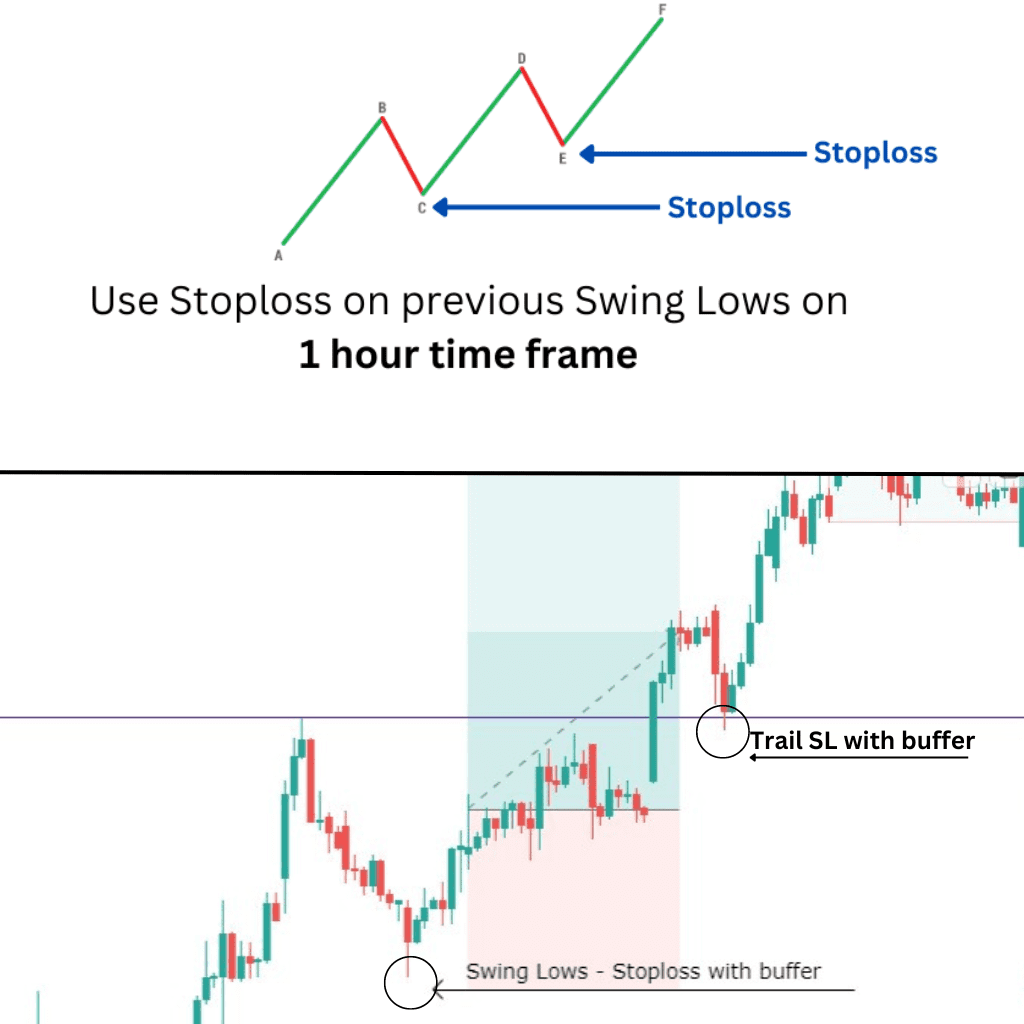
Stoploss/Trailing SL - For Professionals
Stoploss Point

Stoploss/Trailing SL - For Professionals
- Use your stoploss on previous swing lows with small buffer in 1-hour time frame.
- Trail your SL or shift your SL to below higher lows.
- Always measure Stocks behaviour and volatility based on past performance and use your stoploss accordingly.(For beginners we recommended to use ATR to put your stoploss)

Stoploss/Trailing SL - For Beginners
Use ATR indicator. It’s a barometer that measures high value = high volatility, low value = low volatility.
ATR Indicator helps you –
- To determining volatility and how much an asset moves in a given time period.
- To set a stoploss/trailing stop loss.
- To determine the position size for each trade.
Those who are don’t know how and where to put your stoploss can use this tool to protect themselves from being stopped out of a trade.
Let’s understand, how to use ATR on our trade –
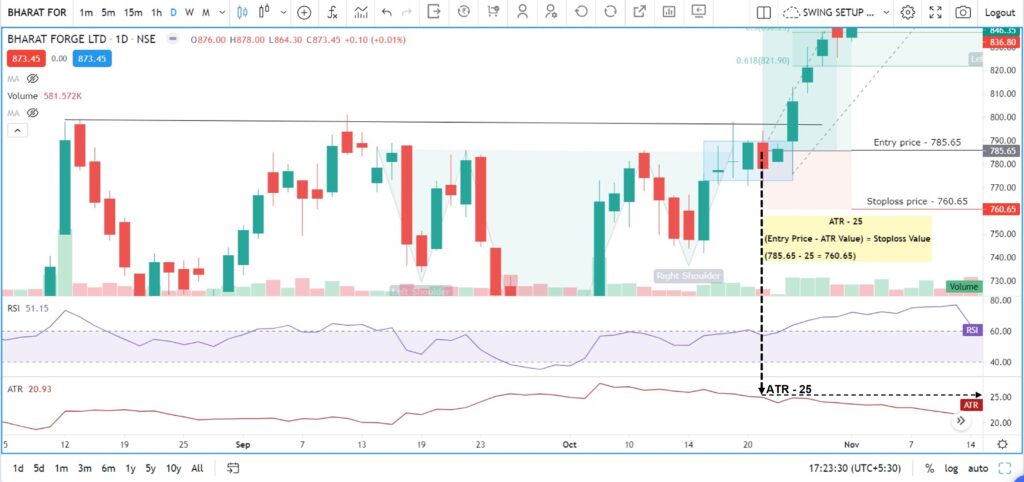
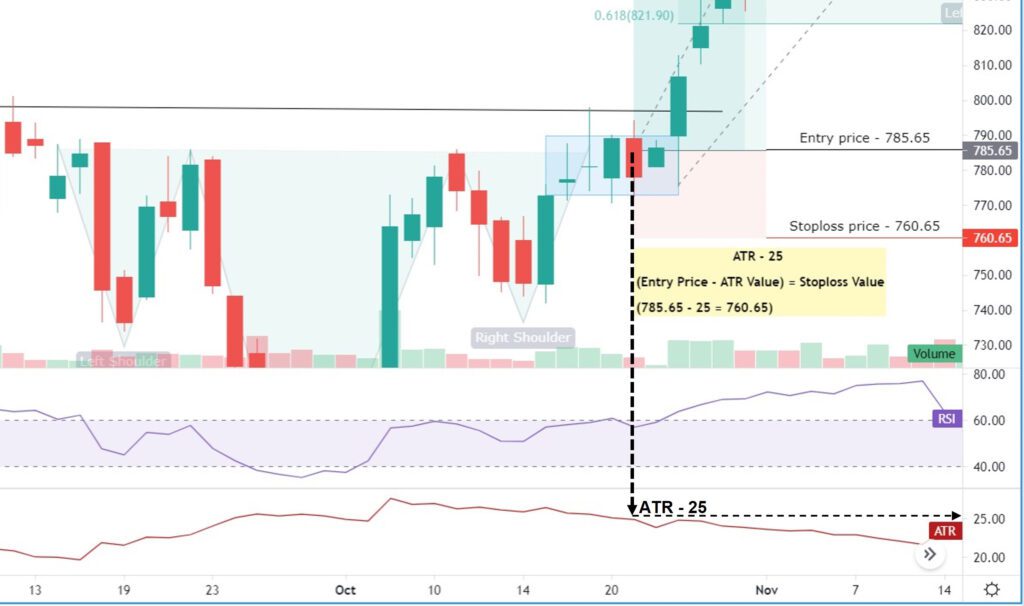
- Entry price – 785.65
- ATR – 25
(Entry price – ATR = Stoploss Price)
(785.65 – 25 = 760.65)
Stoploss price = 760.65
For Trailing SL use this same method to capture full trend.
Pros – Protect yourselves from being stopped out of a trade and to calculate your position sizing.
Cons – According to our system, anyone may easily achieve a risk-reward ratio of 1:3, but after using the ATR, set your target to 1:2.


